
Do you have an answer? A few days ago a challenge problem was offered here. It involved a lifeguard at a beach who wanted to reach a struggling swimmer in the quickest amount of time. What value of X would allow the least time? Running speed in the sand was 4.5 m/s. Swimming speed was 2.4 m/s.

Two Basic Concepts Needed
First, you need to use the Pythagorean Theorem where the hypotenuse squared equals the sum of the squares of the other two sides. The guard needs to follow two distances shown in red in order to reach the swimmer. The first distance d1 is the hypotenuse of the upper left triangle in the sand. The second distance d2 is the hypotenuse of the lower right triangle in the water. In the two triangles, we would write (d1)2 = 302 + X2 and (d2)2 = 402 + (50-X)2. We don’t know what value of X solves the problem. But, we can still express the concepts in terms that include the unknown X.
The second concept needed is about distance, rate, and time. You know how that works. If you drive a distance of 200 km at a rate of 50 km/hr, it will take a time of 4 hr to reach your destination. You divide distance by the rate to get the time. We will use that idea here to find the total time T for the two parts of the problem. In the statements below, values of v1 and v2 are the running and swimming rates of the guard. The last line of the expression needs the 4.5 m/s and 2.4 m/s rates to make it complete.

Three Ways To Get The Value Of X
First, there is brute force of calculation. Put in the values for the running and swimming rates in the last expression above. Try a value of X by guessing. Write it down. Try another one, and another, etc. In time, you will begin to narrow down the result by noticing answers that are smaller than others. It is a slow and inefficient method.
Second, use the computing power of a spreadsheet to do those many trial calculations for you. It is quicker and can yield a value for X that is pretty close to correct. Yes, you need to know how to work with spreadsheets in order to use this method. That isn’t trivial. I’ve included a screen shot of the first part of the spreadsheet from my computer.
The highlighted cell under the T was calculated using the function fx in the entry bar that starts with =((900 +. The formula for fx was copied down the T column into each cell. The values in the column X are test values for the guard’s entry into the water. The spreadsheet includes values for X to 50.

Doing it this way speeds up the calculations. Values for X can be adjusted and changed as one narrows in on the minimum total time T in the next column. You can even try different running and swimming speeds if you want. Spreadsheets will also allow charts to be made to visualize the results. It is a powerful tool.
Recently, I noticed a chart in an article that used data from a spreadsheet. The chart allowed the reader to interact with it and explore values on it. It was called plotly. The online site allows the user to upload a spreadsheet and display the data in a wide variety of charts. I created this one using plotly from my spreadsheet mentioned above. Click on the blue chart to be taken to the url. You can then move your mouse around over it to answer the question for the least time for the rescue by the lifeguard. It will give you a reasonable, but not exact, answer.
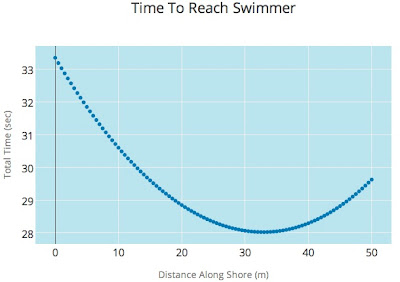
Third, this method utilizes a great graphing application on my Apple computer called Grapher. With it, I entered the equation generated in the earlier part of this post for total time T. It looked a lot like what you see within the big brackets (….) in the image below. Grapher generated a plot instantly just like the blue one above. The challenge question is asking for the value of X that makes the graph above reach exactly its lowest value. At that point, it would have a slope = 0.
In calculus, the first derivative of a function is the slope of the function. The application Grapher is able to calculate the derivative and plot the resulting function. That has been done below. The screen shot shows a line crossing the x axis with a value = 0 where a dotted line runs vertically. The bottom of the image shows x = 32.85957 meters as the solution to the lifeguard problem.

Thanks for joining me on this challenge. I hope you didn’t get a bad sunburn.

Blisters. 😉
Sorry. Next time use SPF40. 😥
Very good, Jim.
This would be good material to use for lifeguard training, but I would add a couple of observations. The top diagram is misleading in this case because it indicates that the lifeguard needs to aim his running trajectory to the right of the victim. Intuition, however, would indicate the opposite since the swimming speed is so much slower than running speed, and of course that turns out to be the case (x is greater than 50/2). The illustration ought to bend opposite to what is shown. Also, in a typical rescue operation there would be a current to complicate the matter, probably an undertow carrying the rescuee away from the shore. An instruction program would do well to illustrate several such variations.
I placed the aim there on purpose. Your intuition was correct. In the original post posing the problem, it was stated no current would complicate matters.
Thanks for the feedback.
When I taught calculus, the textbook’s chapter on maxima and minima invariably included some version of this problem. Students were expected to set up a function representing the total time needed to reach the goal (in this case the swimmer), then calculate the derivative and use it to minimize the value of the time function.
As you point out, nowadays people use spreadsheets and graphing programs, but when I taught calculus in the 1970s, ’80s, and ’90s, students had to manually take the derivative of the complicated time function, set it equal to 0, and solve the resulting equation. It could be tedious, but good students managed to do all that.
What do you think. Have students lost something in not being forced to do it manually? Has automation and using the right app made knowledge better, or worse?
Seems to me, we ought to teach them to do the manual way. Then, show them tools to speed that up once they know how it works. Don’t give them a black box that solves stuff without some context to it.
Cynical me has gotten to the point where I’d be happy if high school “graduates” could do arithmetic manually, let alone calculus.
I never got around to actually trying to solve the problem–but now that I see the answer, I know that I wasn’t planning to approach it in exactly the right way.